Trying to decide whether a company is a solid option for investment? Financial ratios — equations for evaluating the financial performance of a company — are a must-know tool. This guide walks through calculating, interpreting, and combining five widely used ratios: earnings per share (EPS), price-to-earnings (P/E) ratio, price-to-book (P/B) ratio, dividend yield, and return on equity (ROE).
What are financial ratios?
Financial ratios are simple equations that compare two numbers from a company's financial statements. They turn dense figures into quick, comparable measures of how a business earns, spends, and holds its value.
Investors use them to answer practical questions: is this company profitable, is the stock priced fairly, and how does it stack up against similar companies? Because ratios standardize performance, you can compare a large company to a small one, or track a single company over several years.
No single ratio tells the whole story. The most useful approach is to read a few complementary ratios together, which is what the rest of this guide walks through.
Types of financial ratios
Analysts usually sort financial ratios into a few broad groups, each answering a different question about a company:
Profitability ratios: measure how much profit a company generates, such as return on equity (ROE) and earnings per share (EPS).
Valuation ratios: compare a stock's price to a company's earnings or assets, such as the price-to-earnings (P/E) and price-to-book (P/B) ratios.
Liquidity ratios: show whether a company can cover its short-term bills.
Leverage ratios: show how much a company relies on debt.
Efficiency ratios: show how well a company uses its assets to generate sales.
This guide focuses on five ratios that are especially useful when you're evaluating a stock: EPS, the P/E ratio, the P/B ratio, dividend yield, and ROE. Together they cover profitability, valuation, and the income a stock pays.
Ratio | What it measures | Formula |
|---|---|---|
| Earnings per share (EPS) | Profit earned for each share of stock | (after-tax net income − preferred dividends) ÷ weighted-average shares |
| Price-to-earnings (P/E) | How much investors pay for each dollar of earnings | price per share ÷ EPS |
| Price-to-book (P/B) | Stock price relative to net asset value on paper | price per share ÷ book value per share (BVPS) |
| Dividend yield | Cash income from dividends relative to price | annual dividends per share ÷ price per share |
| Return on equity (ROE) | Profit generated per dollar of shareholders' equity | net income ÷ shareholders' equity |
Earnings per share (EPS)
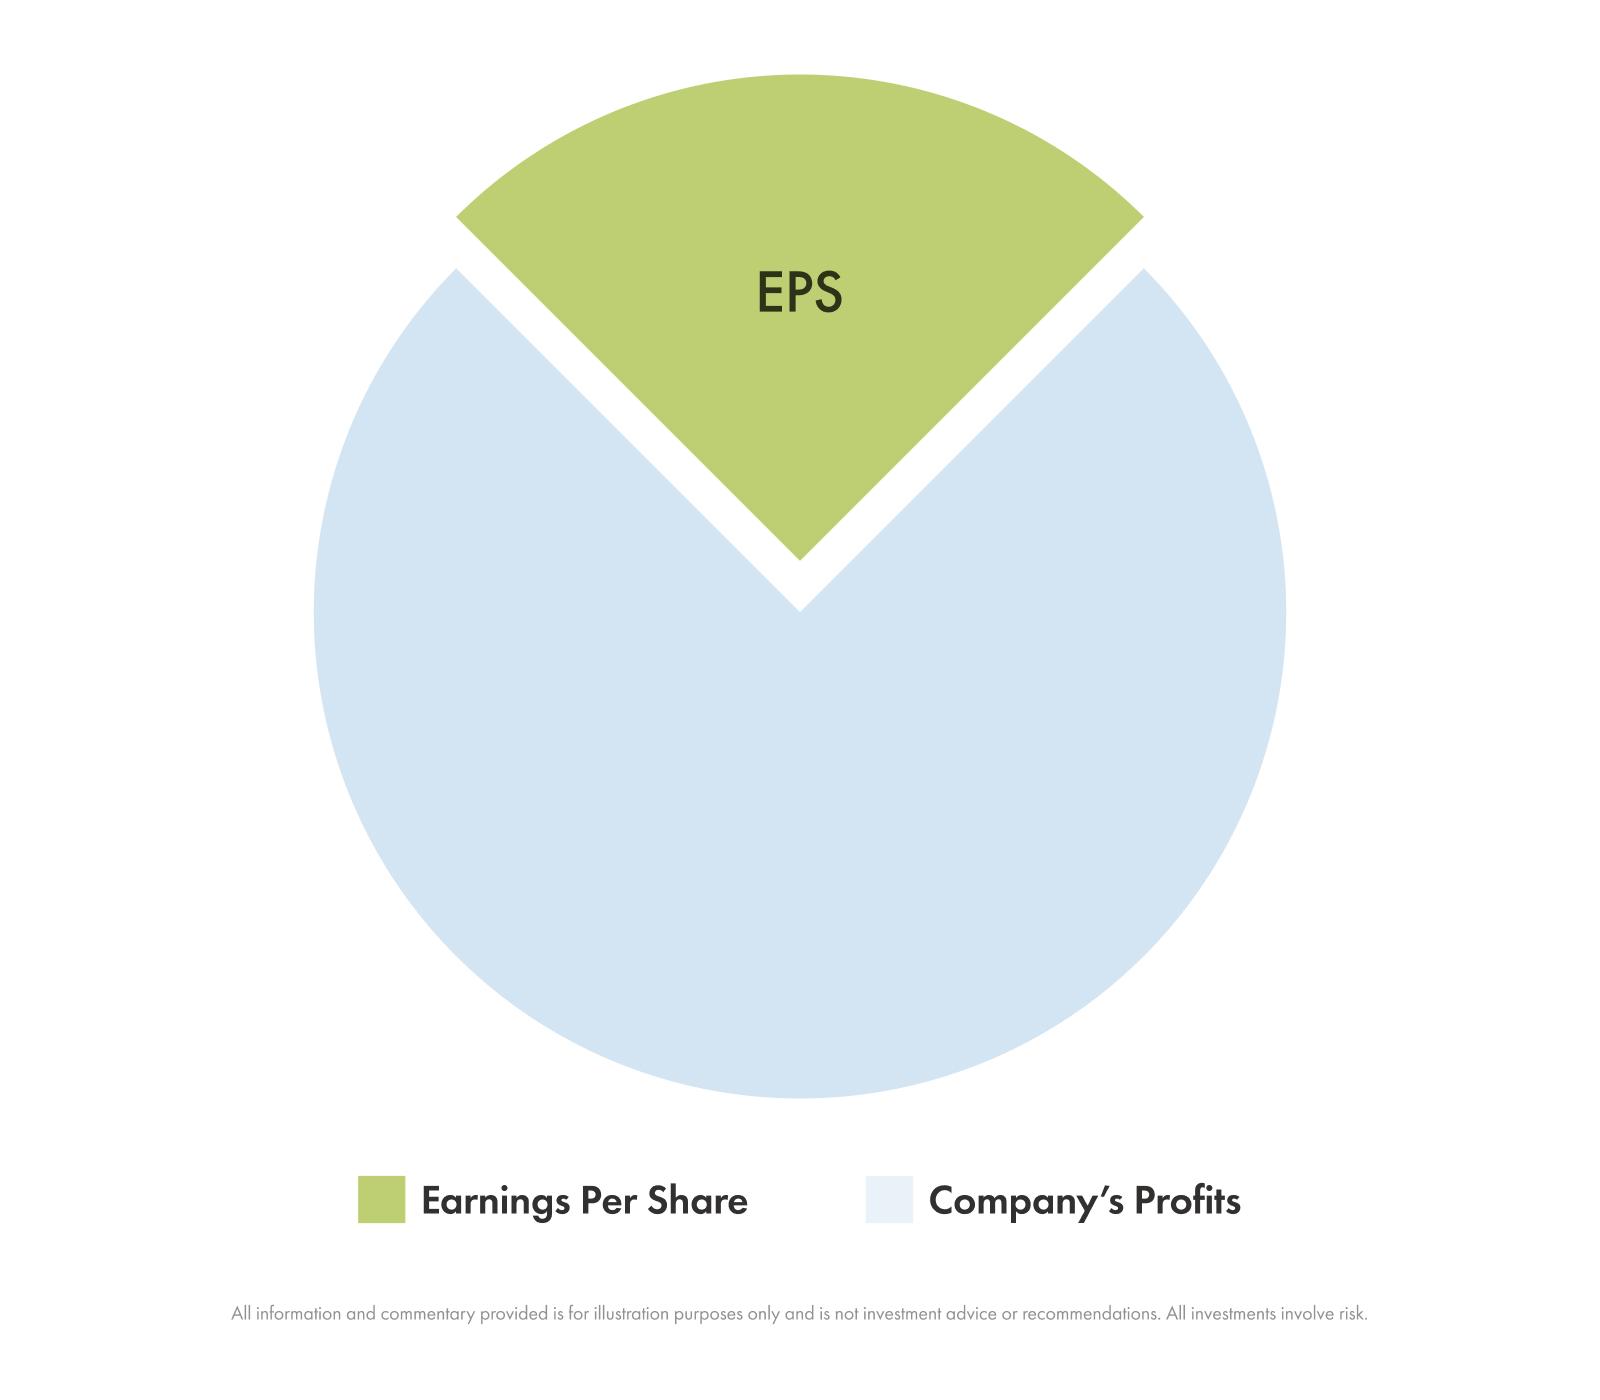
Earnings per share (EPS) shows how much profit a company makes for each share of stock. It's one of the simplest ways to see whether a company is actually earning money and how that's changing over time. EPS feeds into ratios like price-to-earnings (P/E) and helps reveal long-term growth trends.
How to measure EPS
Formula: EPS = (after-tax net income − preferred dividends [if there are preferred shares]) ÷ weighted-average shares
There are two versions of EPS: basic and diluted. Basic EPS uses the weighted-average number of shares outstanding over the reporting period. Diluted EPS assumes all possible new shares — like employee stock options or convertible bonds — are created, which spreads the profits over more shares and usually makes EPS a bit lower, offering a more conservative view of profitability.
How to interpret EPS
Look at multiyear EPS trends to see if the company's earnings have been rising steadily or moving up and down. Then check what's driving those profits: is it strong revenue or improving margins? Keep in mind that significant one-time gains or losses can make EPS look unusually high or low.
Strengths of EPS
It's a core measure of profitability and the starting point for key valuation tools like the P/E ratio.
Limitations of EPS
EPS can be affected by accounting decisions or share buybacks, which don't always reflect the company's true performance. And remember: EPS shows accounting profit, not actual cash flow.
Quick example
If a company earns $100 million and has 50 million shares, its EPS is $2.00 — meaning each share represents $2 in profit. Whether that's strong or weak depends on how it compares to the EPS of similar companies in the industry, and whether the company's earnings are growing consistently.
Price-to-earnings ratio (P/E)
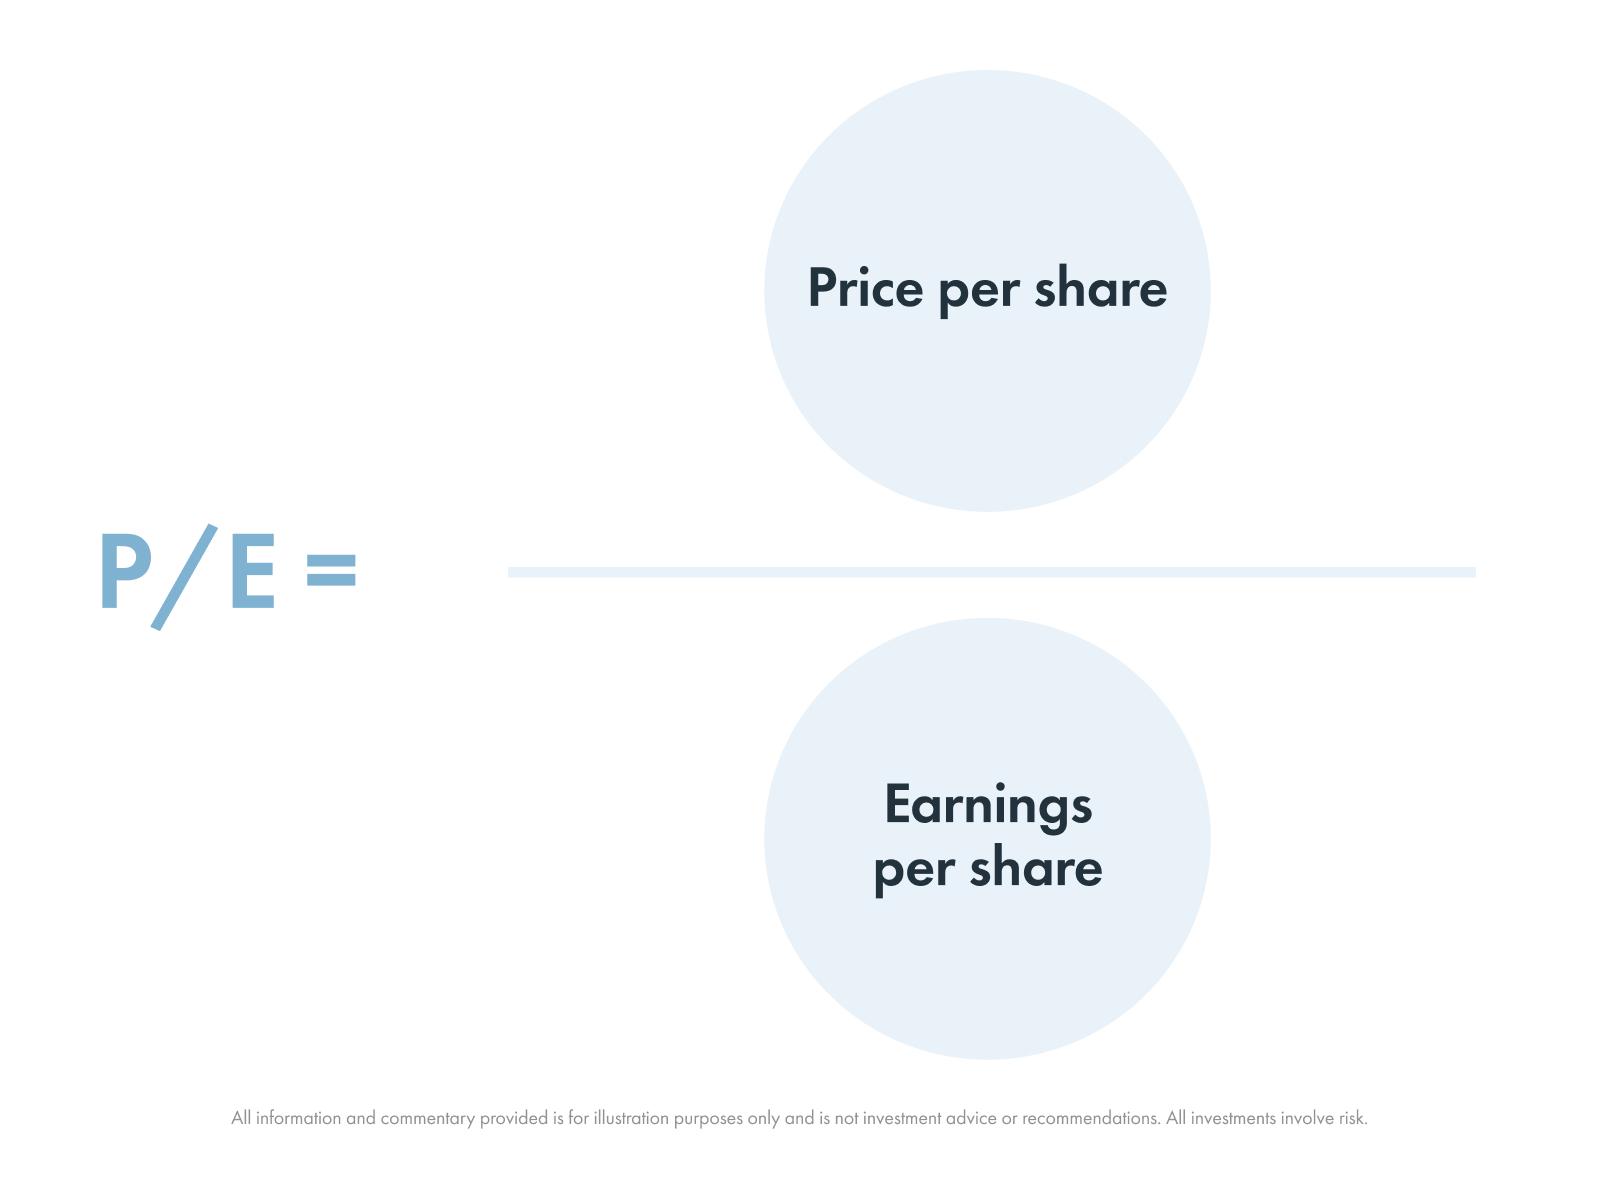
The P/E ratio is one of the most common ways investors gauge how much they're paying for a company's profits. It compares the stock's price to how much the company earns per share, giving a quick sense of whether the market sees the stock as cheap, expensive, or fairly priced.
How to measure P/E
Formula: P/E = price per share ÷ earnings per share (EPS)
You can calculate P/E using past earnings (the trailing 12 months, or "TTM") or expected earnings for the next year. The first shows what the company has earned, while the second shows what investors think it will earn.
How to interpret P/E
Compare the company's P/E to others in the same industry, and to how fast its earnings are expected to grow. A high P/E usually means investors are betting on stronger future growth and see low risk. A low P/E may signal weaker expectations for growth.
Strengths of P/E
It's simple to calculate, widely used, and shows how the stock's market price relates to the company's profitability.
Limitations of P/E
It can be misleading for companies whose earnings are negative or up and down, as well as for cyclical companies (companies whose profits rise and fall with the broader economic cycle). It also varies depending on the accounting method used, which can make it harder to directly compare one company's P/E with another.
Quick example
If a stock trades at $30 and earns $2 per share, its P/E is 15 — meaning investors are paying 15 times the company's earnings. Whether that's high or low depends on how fast the company is expected to grow and how it compares to the P/E of other companies in the same industry.
Price-to-book ratio (P/B)
The P/B ratio compares a company's stock price to what its net assets are worth on paper. It helps investors see how much they're paying for each dollar of what the company actually owns, once its debts are accounted for.
How to measure P/B
Formula: P/B = price per share ÷ book value per share (BVPS)
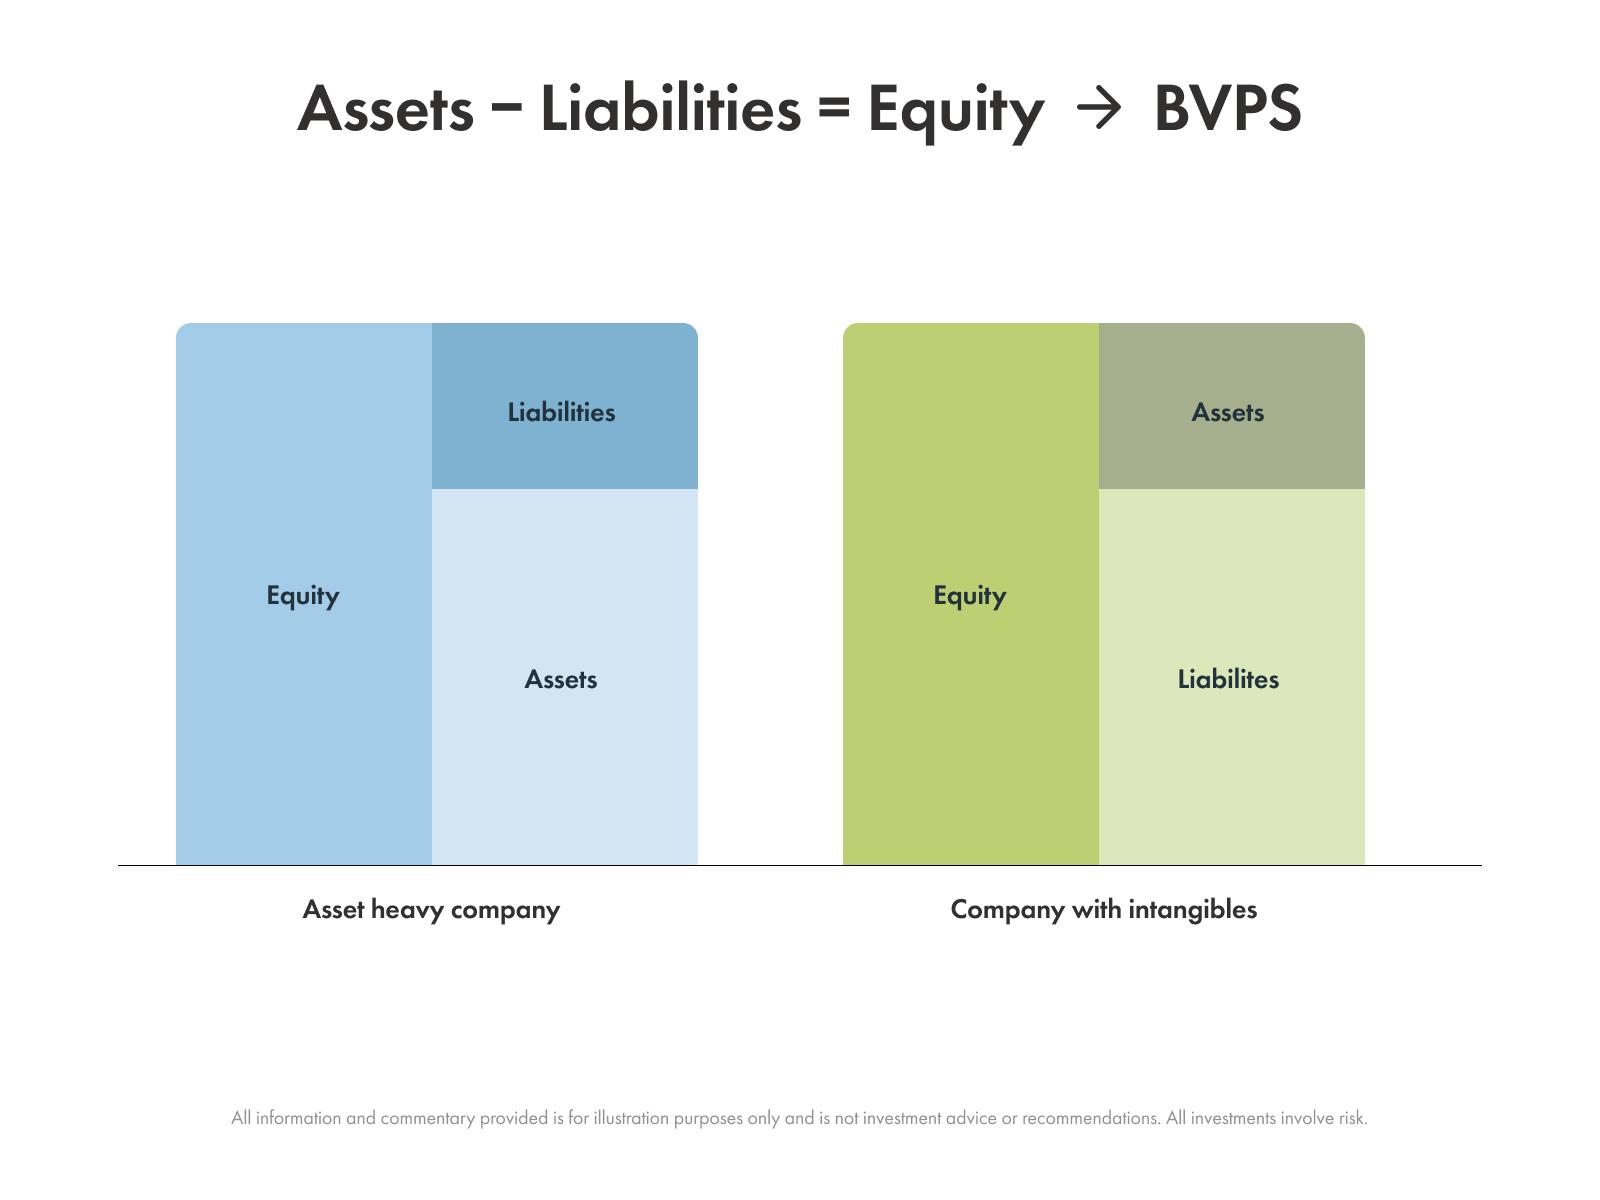
BVPS shows how much of the company's net assets each share represents, calculated by dividing shareholders' equity by the number of shares outstanding. The P/B ratio then compares that book value to the market price to see whether the stock is trading above or below its accounting value.
How to interpret P/B
P/B is useful for evaluating companies that are heavy in assets that drive their value, like banks, real estate firms, and manufacturers. It's less helpful for companies whose value is built on intangible things, like intellectual property or research and development, because those assets usually don't get recorded at their true worth (or at all) on a balance sheet.
For example, a company might spend years building a popular app or a strong brand, but accounting only captures the value of those when they're bought.
Strengths of P/B
It keeps valuation grounded in tangible assets (what the company actually owns) and gives a steadier view of value that's less affected by short-term changes in profit.
Limitations of P/B
It can be misleading if the BVPS number used is outdated, which can happen if the company's assets aren't regularly revalued. It's also not a very representative metric for companies with different asset structures or intangible assets.
Quick example
If a stock trades at $20 and its BVPS is $10, the P/B is 2.0, meaning investors are paying twice the accounting value of the company's net assets. Whether that's high or low depends on how efficiently the company uses its assets, how its P/B compares to others in the same industry, and how much of its value comes from intangibles that a balance sheet usually doesn't capture.
Dividend yield
Dividend yield shows how much income an investor earns from a stock's dividends compared to the price of the stock. It's a simple way to see how much cash return you're getting for every dollar you invest.
How to measure dividend yield
Formula: dividend yield = annual dividends per share ÷ price per share
This tells you how much dividend income you earn from a company's stock each year compared to what it costs. In other words, it shows the percentage of your investment that comes back to you as cash dividends.
How to interpret dividend yield
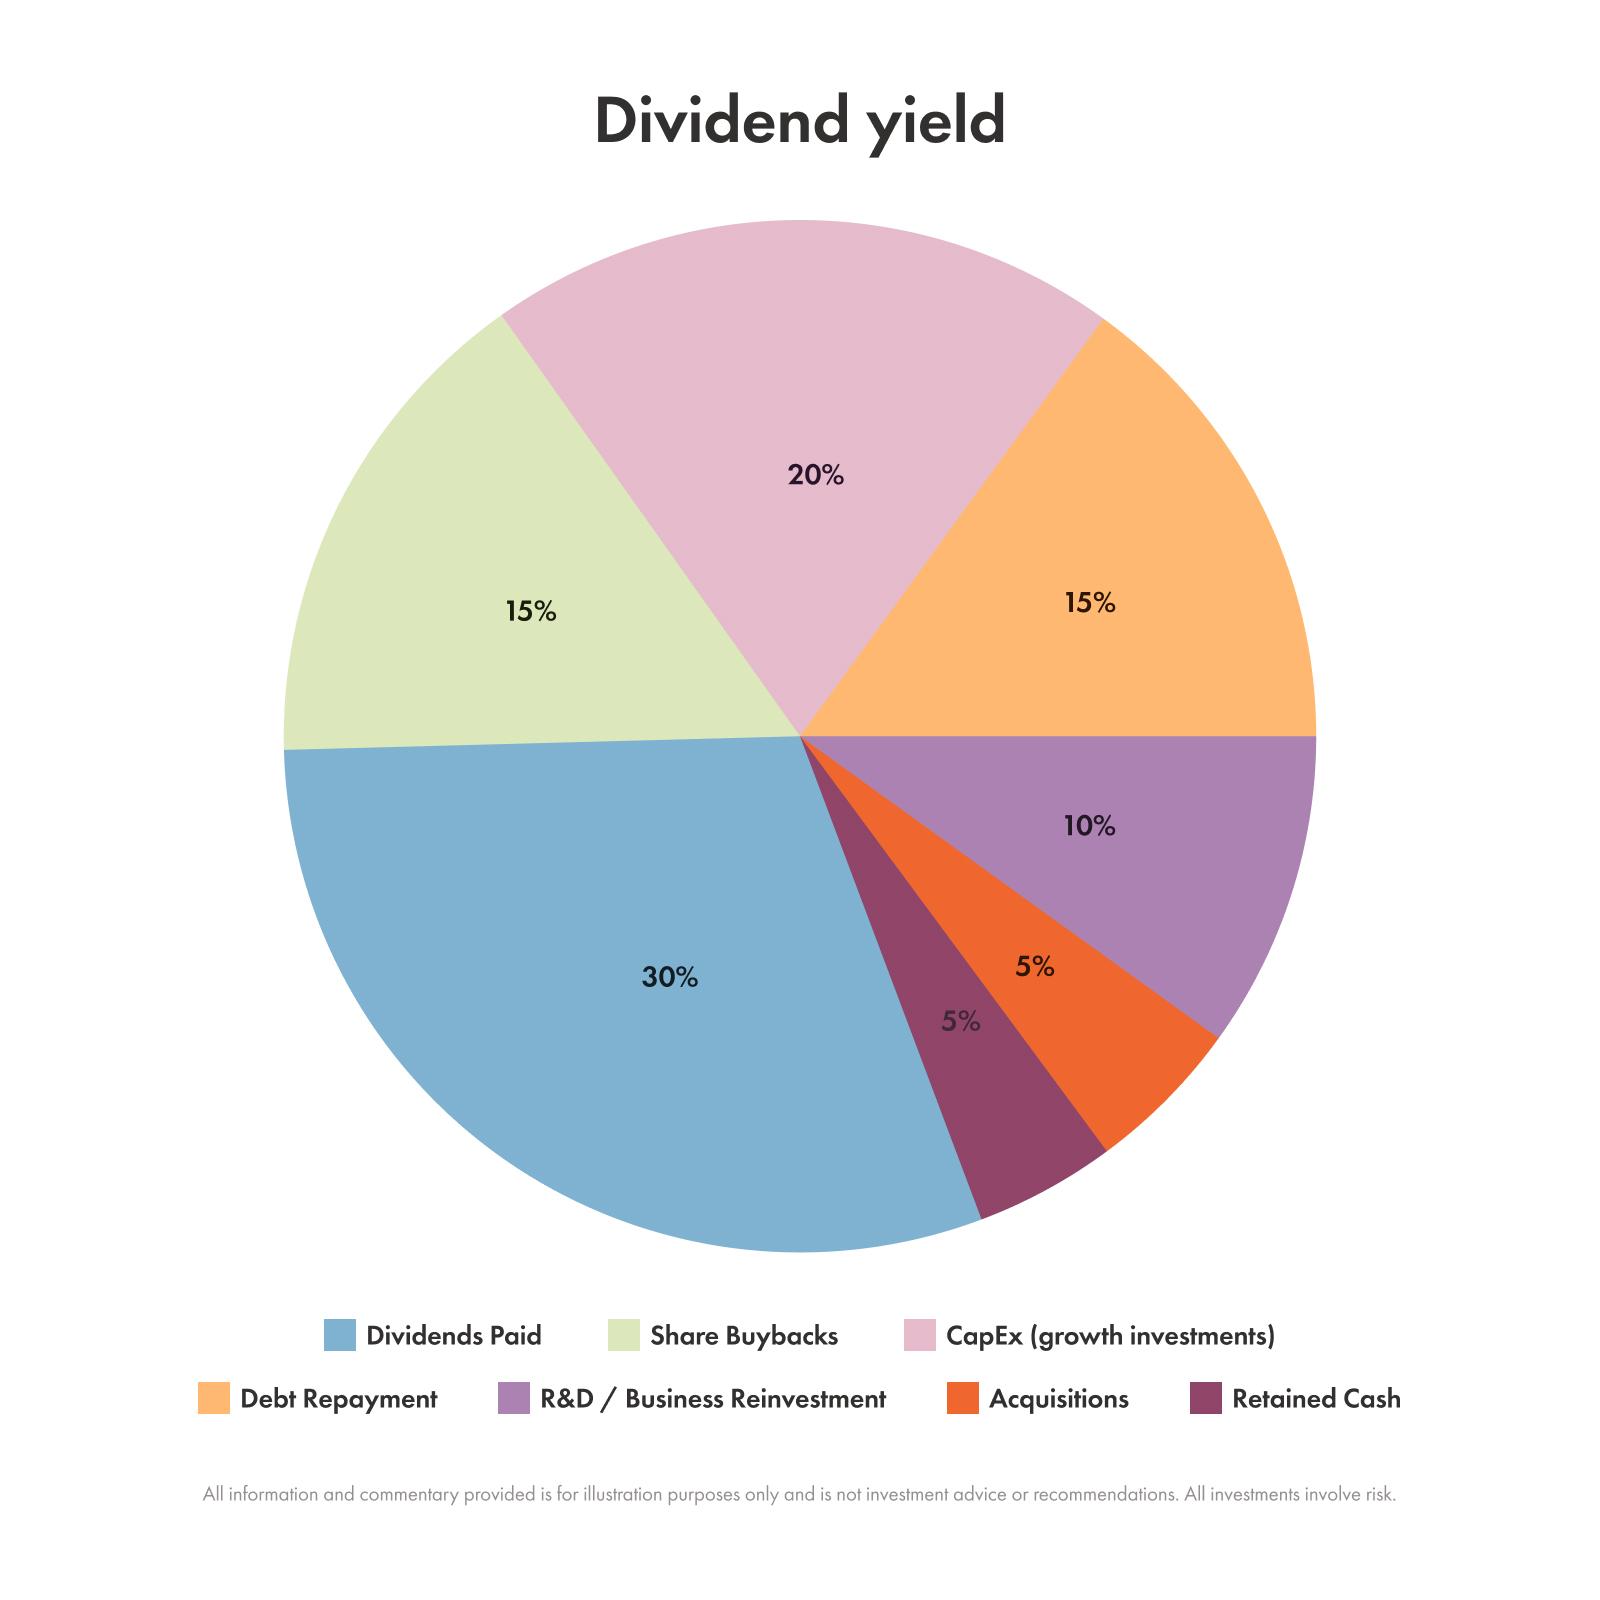
A higher yield means investors get more income per dollar they invest. But that's only worthwhile if the dividend is sustainable, meaning the company can pay it consistently over the long term, or increase it.
Check whether the company's payout ratio (dividends as a share of earnings) and free cash flow can comfortably cover dividend payments. Sustainable or growing dividends are a good sign; extremely high dividend yields might signal risk.
Strengths of dividend yield
Dividend yield gives a clear view of the cash return investors receive and makes it easy to compare income potential across dividend-paying stocks.
Limitations of dividend yield
A high yield isn't always a good sign. Sometimes it's caused by a falling stock price rather than a solid payout (what's called a "yield trap"). Dividends can also be cut or suspended if the company's profits decline.
Quick example
If a company pays an annual dividend of $1.00 and the stock trades at $25, the dividend yield is 4%. That means you'd earn $4 in dividend income for every $100 you invested, based on the current dividend rate.
Return on equity (ROE)
ROE shows how effectively a company turns the money invested by its shareholders into profits. It's a simple way to evaluate how well the company uses its own resources (not borrowed money) to generate earnings and grow the business.
How to measure ROE
Formula: ROE = net income ÷ shareholders' equity
ROE tells you how much profit a company makes for every dollar of shareholders' equity. The higher and more consistent the ROE over time, the better.
How to interpret ROE
A higher ROE means the company is earning more profit per dollar of equity, which usually points to strong leadership and efficient operations. To gauge whether an ROE figure is strong or weak, compare a company's ROE to its own past results and to others in the same sector.
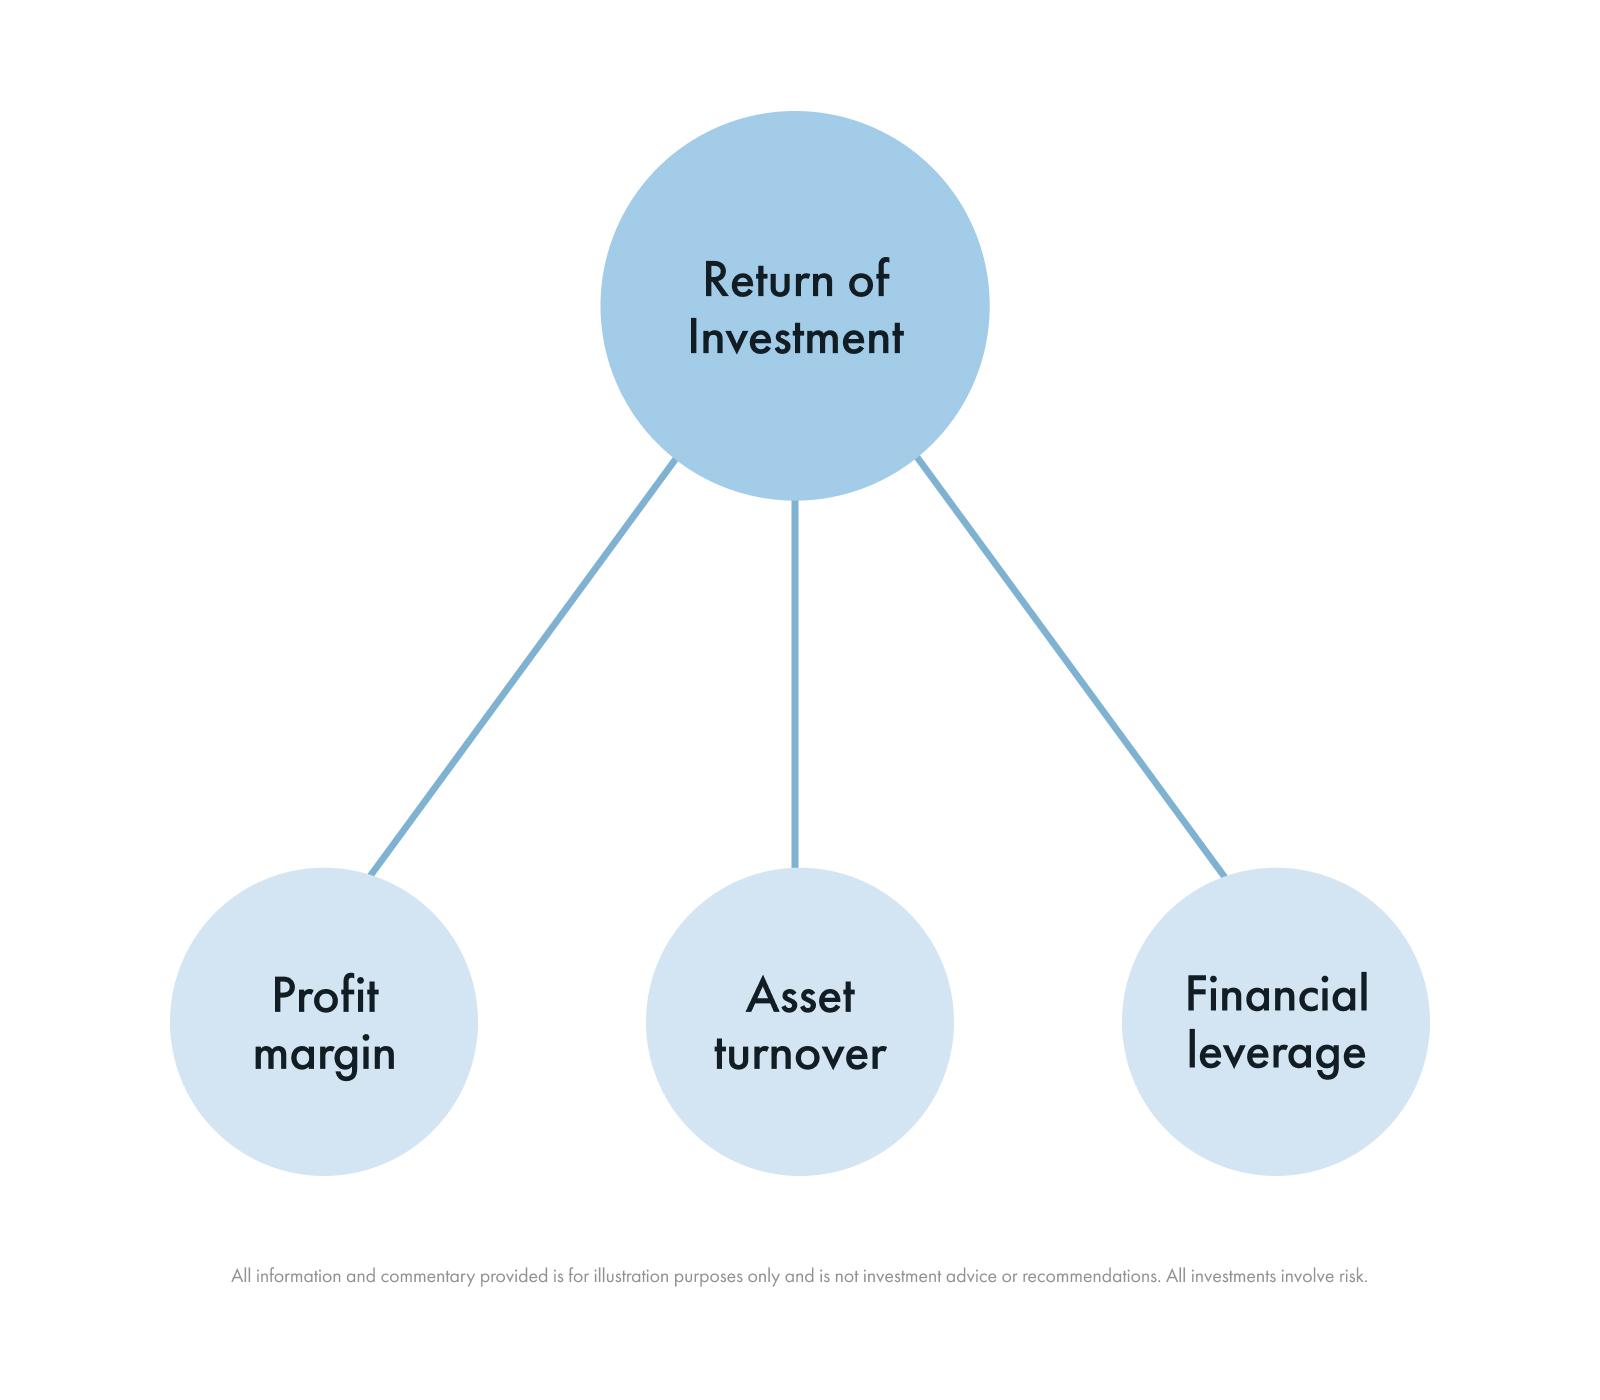
To see what's really driving returns, analysts sometimes break ROE into three parts: profit margin × asset turnover × financial leverage. Called a DuPont analysis, this breakdown shows whether a strong ROE comes from earning good profits on sales (margin), using assets efficiently (turnover), or taking on debt to boost results (leverage).
Strengths of ROE
ROE offers a holistic, big-picture view of a company's profitability and signals how well it's using shareholder money to increase value over time.
Limitations of ROE
ROE doesn't always tell the full story. A company can show a high ROE because it's using a lot of debt, not because it's actually more profitable. ROE can also be inflated by share buybacks, which reduce the equity that profits are compared to, and it becomes less useful or even misleading when shareholders' equity is very small or negative.
Quick example
If a company earns $15 million in net income and has $100 million in shareholders' equity, its ROE is 15%. That means it generated a 15% return on the money invested by its shareholders.
Combining key ratios
No single ratio can give you a complete picture of a company's investment worthiness. To really understand a company's financial performance and long-term attractiveness for investment, it helps to look at several ratios side by side. Here's how:
Look at value and performance together. Pair valuation ratios like P/E and P/B with quality and growth metrics such as ROE and EPS. This helps you understand not just what investors are paying for the stock, but whether the company's profits and efficiency are improving over time.
Verify cash support. Check that a company's EPS and dividends are backed up by real cash flow. Look at operating cash flow, free cash flow, and the payout ratio to make sure profits and payouts are sustainable.
Use consistent inputs. Base evaluations for all ratios on consistent time frames and data sources. For example, don't compare a trailing P/E (based on past earnings) with a forward EPS (based on future estimates); because the two measure different periods, the comparison wouldn't offer any meaningful insight.
Consider sector norms. Always compare a company's ratios to others in the same industry, not across unrelated sectors. Different industries have different "normal" ratios. For example, tech companies often have higher P/Es because investors expect faster growth and will pay a higher price, while utility companies usually have lower ratios because their growth is steadier and more predictable.
Look at multiyear trends. One year doesn't tell a complete story. Seasonal effects, one-time gains, or temporary setbacks can make results look better or worse than they really are. Evaluate multiyear trends across different ratios to get a sense of true performance patterns.
Financial ratios tell the story of how a company earns, grows, and rewards its investors. By looking at ratios of value, profitability, and cash flow together, you can see past short-term price moves and judge whether the company behind the stock is a sound long-term investment. Used the right way, these ratios can help you make more confident investing decisions based on substance, not hype.