Getting an understanding of technical analysis, including support and resistance, is about learning to read the story the market is telling. It's a skill that takes practice, but it can be a useful addition to your investing toolkit. It helps you make more informed decisions and could even add a bit of fun to your financial journey.
What is technical analysis, anyway?
Before we dive into drawing lines, let's quickly chat about technical analysis . Think of it as studying a stock's past behaviour to get a feel for what it might do next. Instead of poring over company balance sheets (that's fundamental analysis, a whole different ballgame), technical analysts focus on charts, looking for patterns, trends, and support and resistance levels.
What is support?
Support is a price level where a downtrend tends to pause because enough investors step in to buy, creating a floor under the price. It marks a zone where demand has historically been strong enough to stop the price from falling further.
Think of it like dribbling a basketball. When the ball hits the floor, it bounces back up. In the stock market, support is like the floor of the basketball court, the level where buyers have jumped in before.
Support can show up in a couple of ways:
Horizontal support: this is the easiest to spot. Think of a previous low price that the stock hit and then bounced off of. If it dips back down to that level, there's a good chance it might find buyers at that price again.
Diagonal support (trendlines): as a stock price rises, it might occasionally dip back down to touch this trendline before continuing its climb. This trendline acts as dynamic support.
Example of support
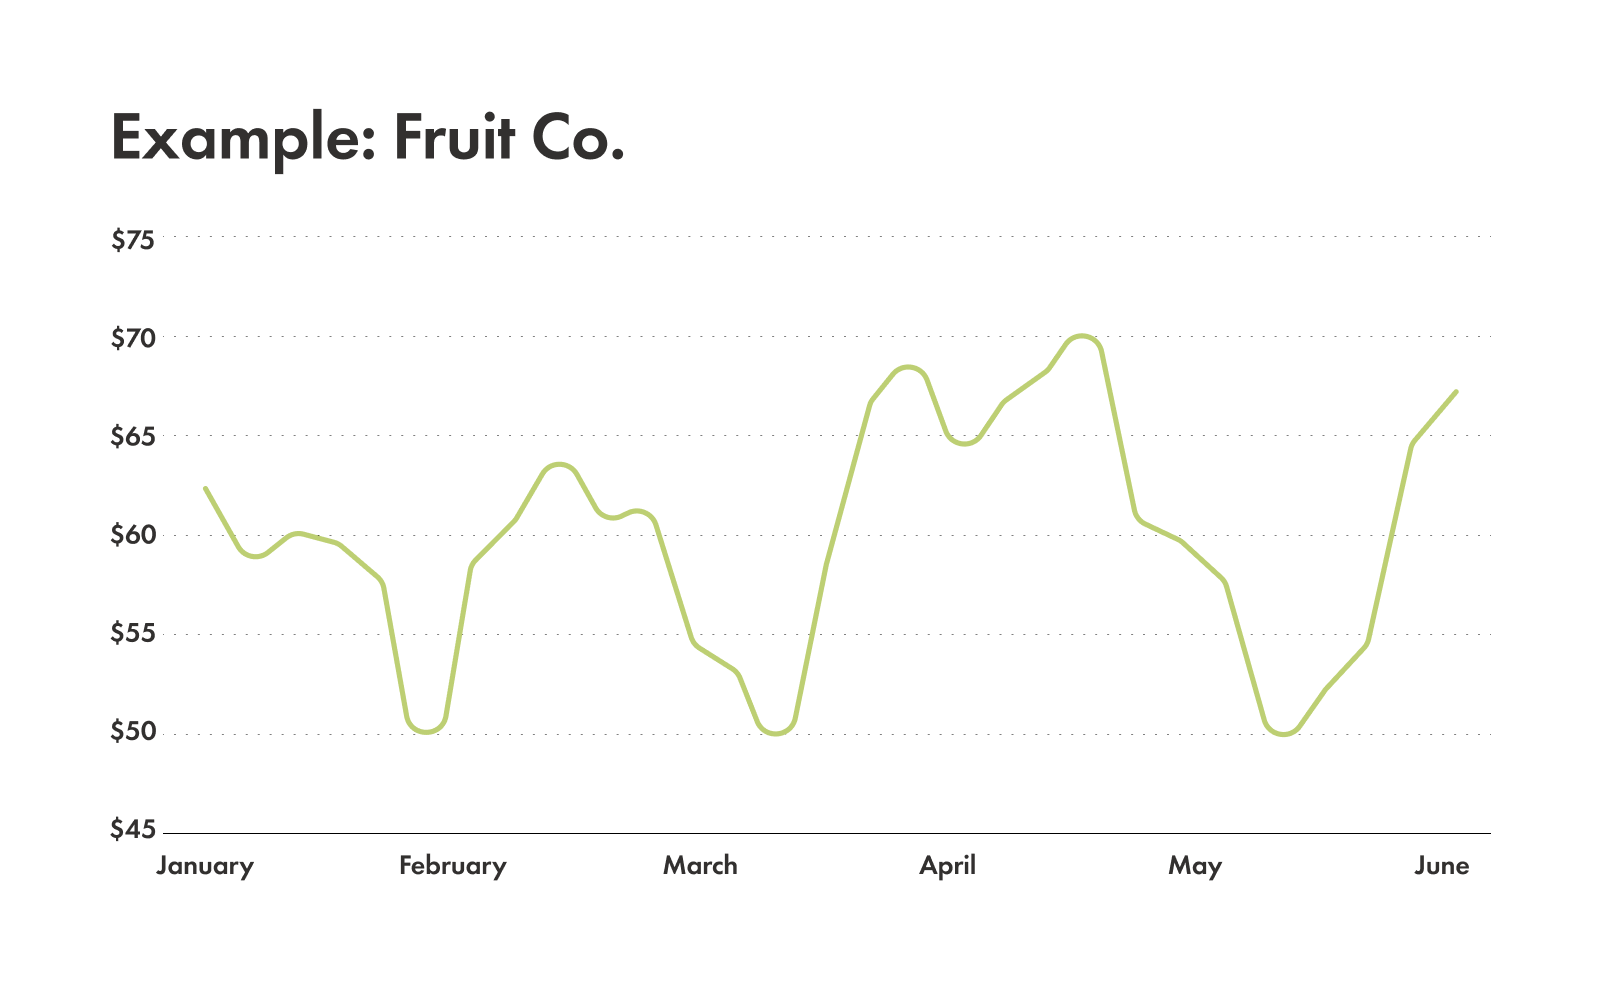
Let's say Fruit Co. stock dropped to $50 three times in the past six months, and each time, it quickly rebounded. That $50 mark is a strong support level, and buyers seem to love it at that price.
What is resistance?
Now, if support is the floor, then resistance is the ceiling. It's a price level where upward momentum tends to stall because sellers step in, ready to take profits or get out of their positions.
Like support, resistance can also be horizontal or diagonal:
Horizontal resistance: this is a previous high price where the stock turned around and went down in price. If it goes back up to that level, sellers might be waiting.
Diagonal resistance (trendlines): in a downtrend, you can draw a declining line connecting a series of higher points. As the stock tries to rally, it might hit this trendline and fall back down, which is dynamic resistance.
Example of resistance
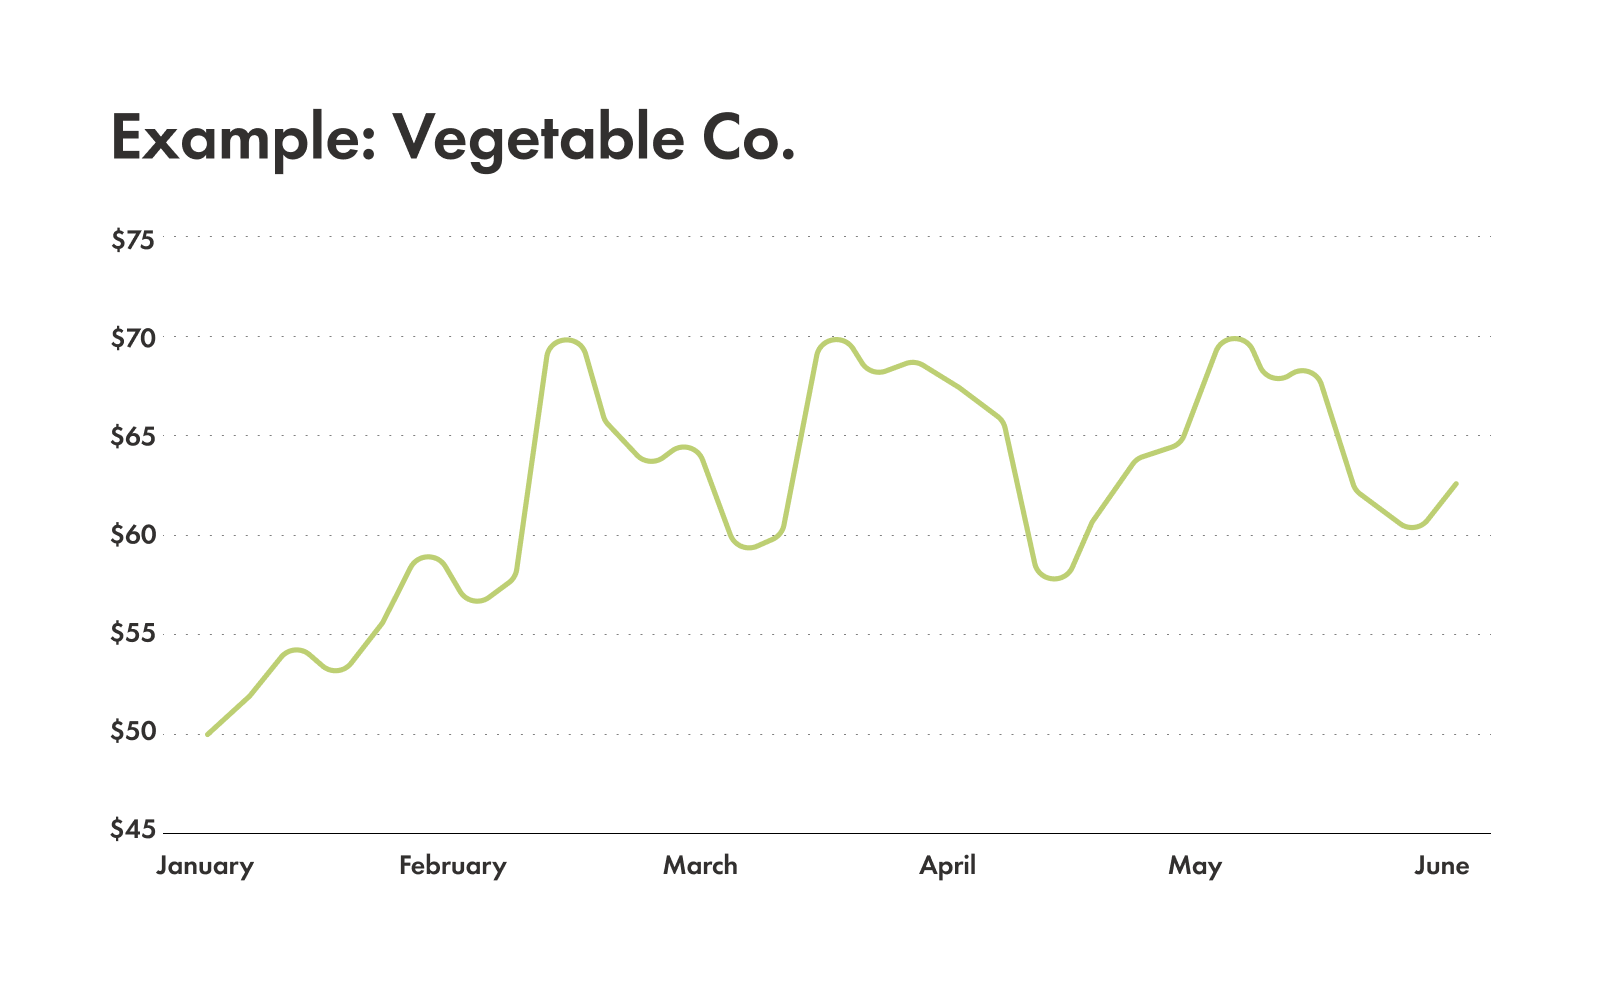
If Vegetable Co. consistently struggles to get past $70, hitting it multiple times before pulling back, then $70 is acting as a resistance level.
How support and resistance switch roles
One of the more useful things to understand about these levels is that they can trade places. When a price finally breaks through resistance and keeps climbing, that old ceiling often becomes the new floor. Buyers who once sold there may step in to defend it instead.
The reverse happens too. When a price falls through support, that old floor can turn into a ceiling that caps future rallies. Traders call this role reversal, and it's one reason a broken level is worth keeping an eye on rather than forgetting.
Broken resistance can become support: after a price pushes above a resistance level and dips back to test it, that level may hold and send the price higher again.
Broken support can become resistance: after a price drops below a support level and later rises back to it, that level may push the price back down.
How to identify support and resistance
So, how do you actually find them on a chart ? It's helpful to think more about identifying "zones" where prices have historically reacted than drawing perfect lines. Here's what to look for:
Historical highs and lows: this straightforward way looks for past peaks and valleys where the price reversed course. The more times a level has been touched and reversed, the stronger it usually is.
Recent price congestion zones: sometimes, stock prices hover in an area for a while, almost like they're trying to figure out what to do next. These areas of "congestion" or sideways movement can become future support or resistance.
Volume analysis: by paying attention to the volume of trades, you can gauge the strength of the level. A high-volume bounce up from support or a high-volume drop at resistance can confirm the strength of the level.
When you do spot these zones, chart tools help to document them:
Trendlines: as mentioned before, connecting the highs or lows can reveal diagonal support and resistance.
Horizontal lines: simply drawing a straight line at significant historical price points can help identify historical resistance.
Fibonacci levels: these mathematical ratios often line up with common support and resistance zones. A bit more advanced for beginners, but something to explore later.
What makes a support or resistance level strong
Not every level carries the same weight. A few signals can help you get a sense of how reliable a support or resistance zone is likely to be.
Number of touches: the more times a price has tested a level and reversed, the more meaningful that level tends to be.
Time held: a level that has held for weeks or months usually matters more than one that formed over a few minutes.
Trading volume: a bounce or rejection backed by high volume tends to signal stronger conviction than a quiet, low-volume move.
Reading these signals together can give you a clearer sense of which zones are worth acting on and which ones may be easier to break.
How to use support and resistance
Now we can put support and resistance to work. You can use them to find:
Entry and exit signals: some traders try to buy near support, expecting a bounce, and sell near resistance, anticipating a pullback.
Stop-loss placement: this is crucial for managing risk. When buying near support, traders sometimes place stop-loss orders just below that support level. If the price breaks below it, that signals the initial idea was wrong and can help limit losses. The same logic applies to shorting near resistance and placing a stop-loss just above it.
Breakouts and breakdowns: when the price moves through a level with strong volume, it's called a breakout (above resistance) or a breakdown (below support). This often signals a new trend or accelerated price action. But watch out for "false breakouts," when the price briefly moves through a level only to quickly reverse. In this case, waiting for confirmation, like a solid close above or below the level, can help.
Key patterns involving support and resistance
Support and resistance are the building blocks for many common chart patterns, like:
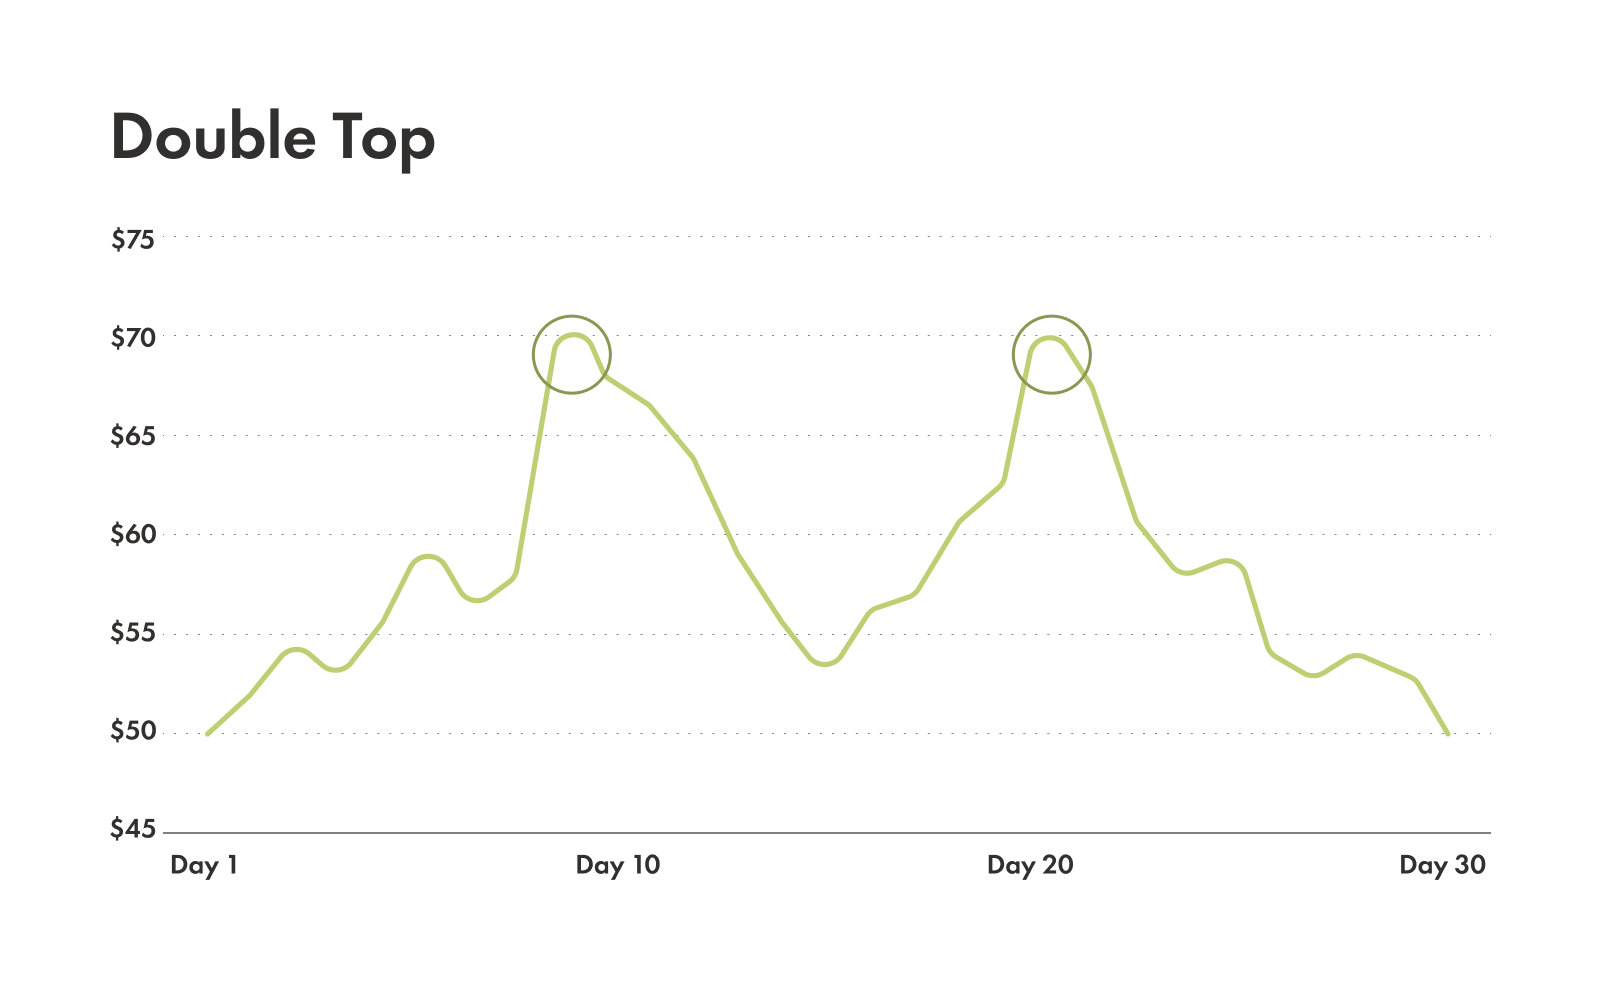
Double top: looks like two peaks at roughly the same resistance level, often signalling a reversal to a downtrend.
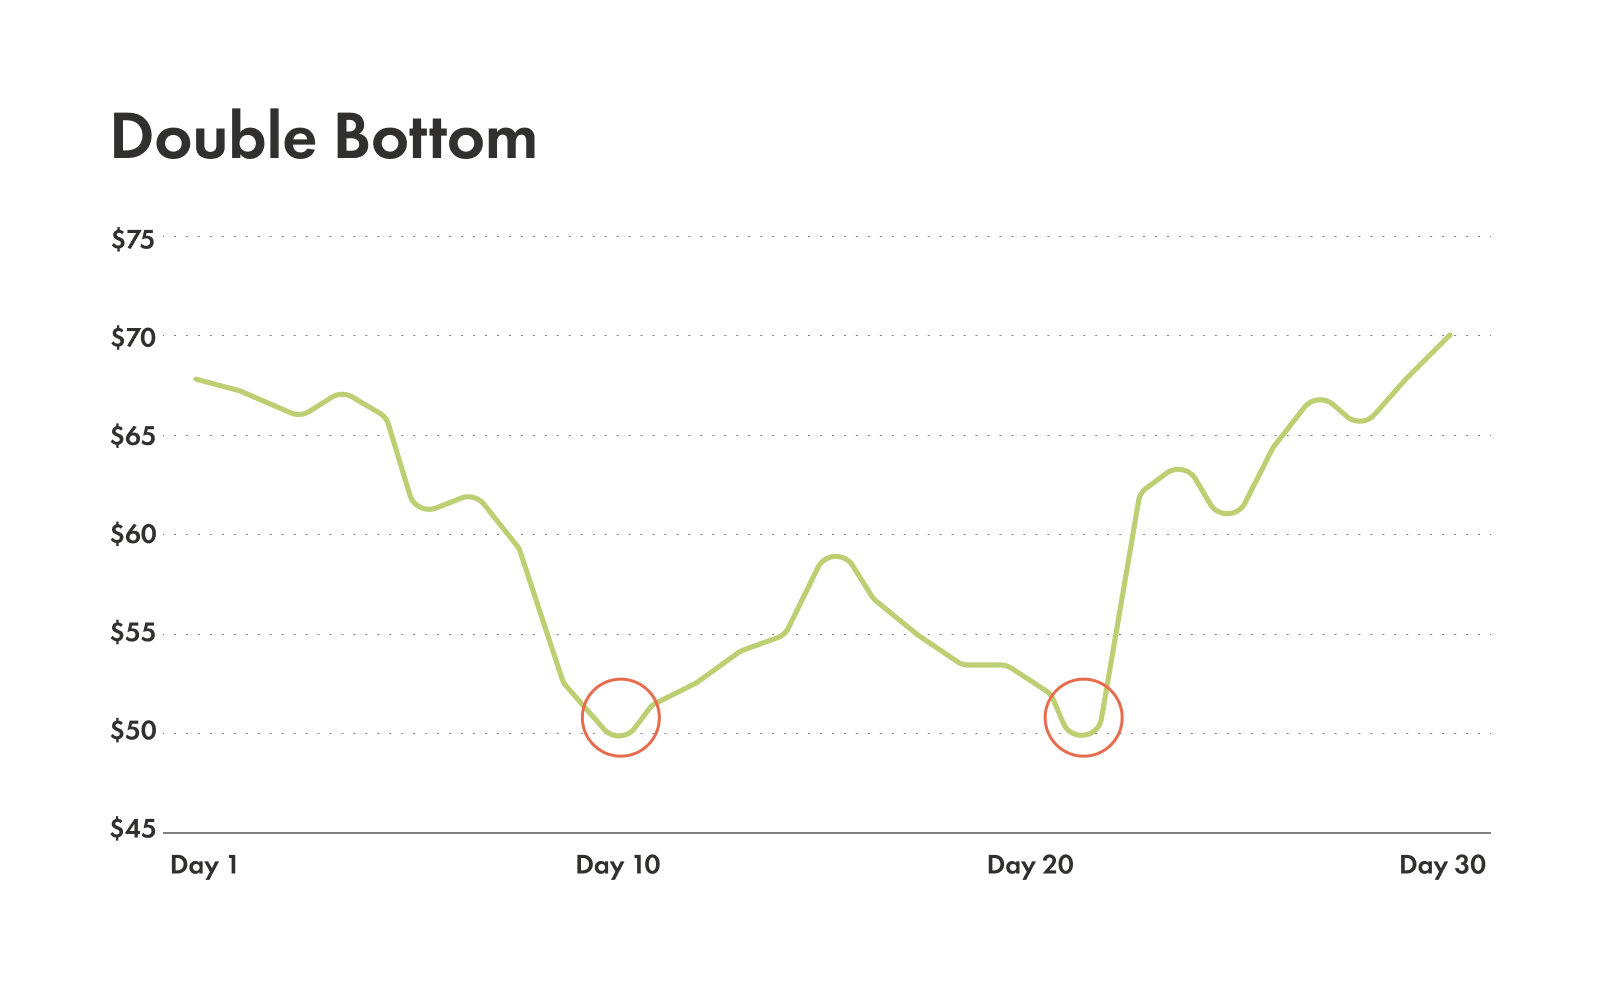
Double bottom: the opposite of a double top, two troughs at a support level, suggesting a reversal to an uptrend.
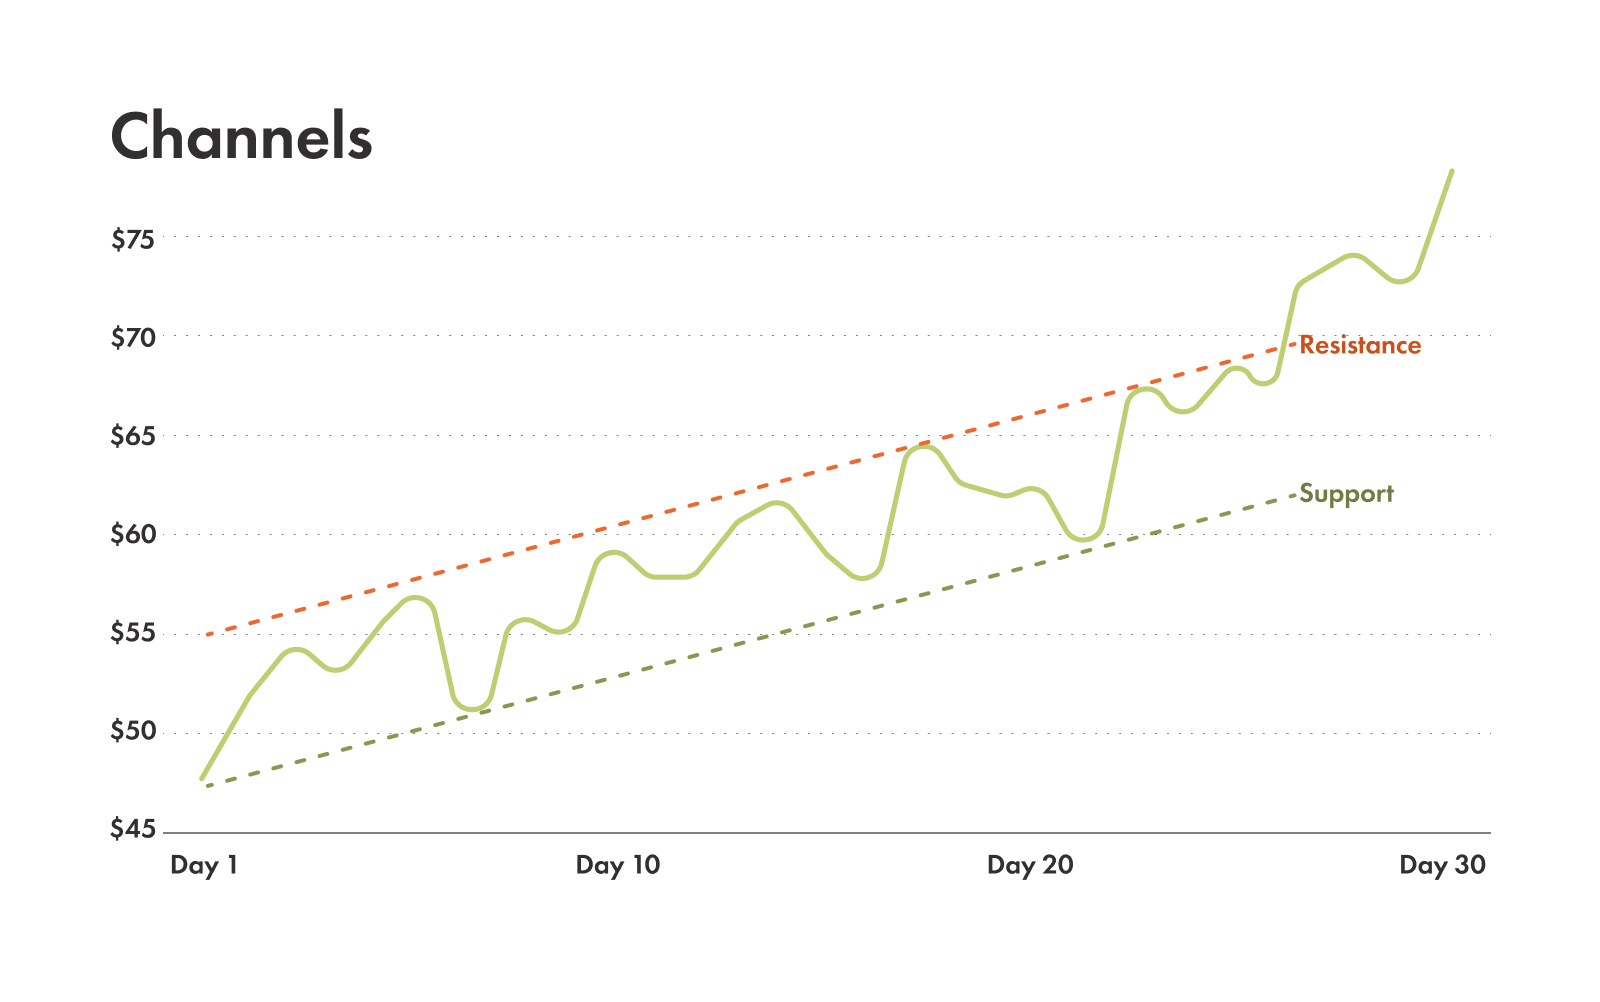
Channels: these are parallel support and resistance lines that contain the price movement as it trends up or down.
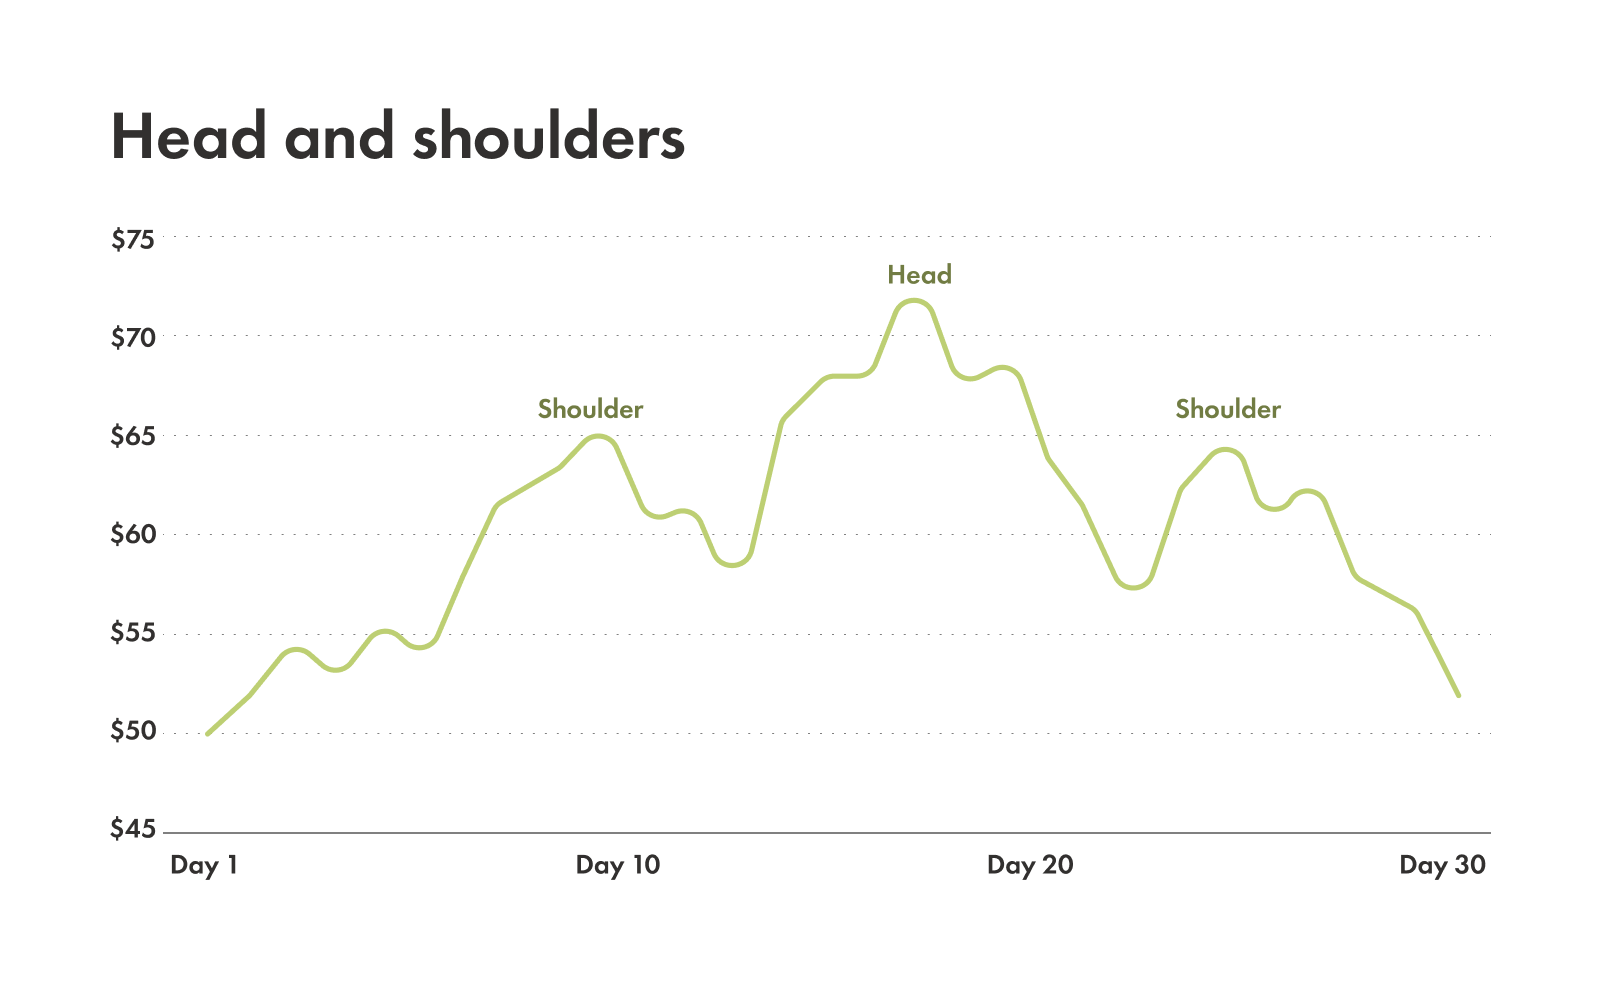
Head and shoulders: this pattern looks like a head with two shoulders. It's a reversal pattern where a central peak (the head) is higher than two surrounding peaks (the shoulders), all typically bouncing off a "neckline" (support). A break below the neckline suggests a downtrend is coming.
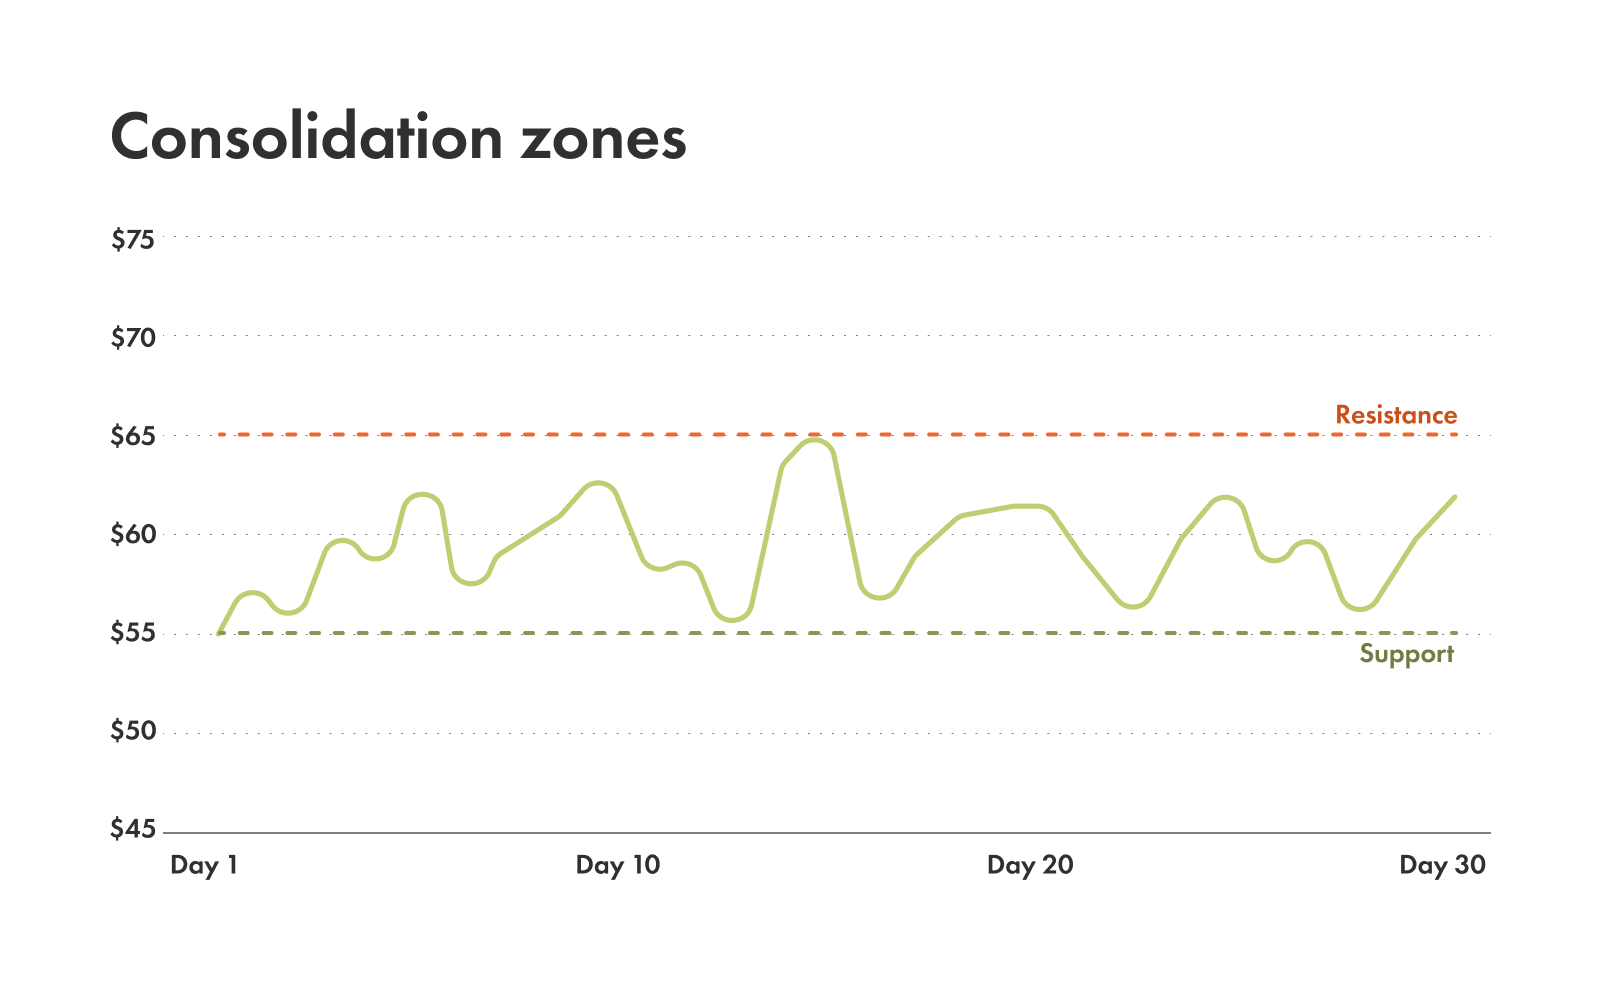
Consolidation zones: sometimes, a stock price bounces back and forth between clear support and resistance levels for an extended period, neither breaking up nor down. This is called consolidation, and it often happens before a significant move.
Common mistakes when using support and resistance
Support and resistance aren't perfect. When using them as investing tools, there are some common issues to keep in mind:
Levels can break: the market is dynamic, and sometimes a level that has held for a long time can finally give way.
Market news: major news events, like earnings reports, economic data, or a global crisis, can disrupt technical setups and override charts.
Over-reliance: don't rely on support and resistance alone. Combining them with other indicators can give you more confidence and a clearer picture.
Putting support and resistance into practice
Support and resistance tend to be most useful as one layer of a bigger picture, not a standalone system. A good place to start is by marking the zones where a price has clearly reversed before, then watching how it behaves the next time it reaches them.
With practice, reading these levels can start to feel like second nature. Pairing them with other signals, like volume and broader trends, can help you make more confident, better-timed decisions over time.