
If you want to be a competent technical trader (and who doesn’t!), you need to understand volume analysis. What’s that? Combined with price changes, volume analysis is a common way to separate real moves from fake or halfhearted ones. And, crucially, it helps shed light on why prices are moving, so traders can confirm trends, reversals, and breakouts.
What is trading volume?
Trading volume is the total number of shares or contracts of an asset that change hands during a set period of time. It’s a core measure of market activity.
A quick example: if 1,000 shares of the (totally made-up) company PEAR were bought and sold today, its stock-trading volume is 1,000.
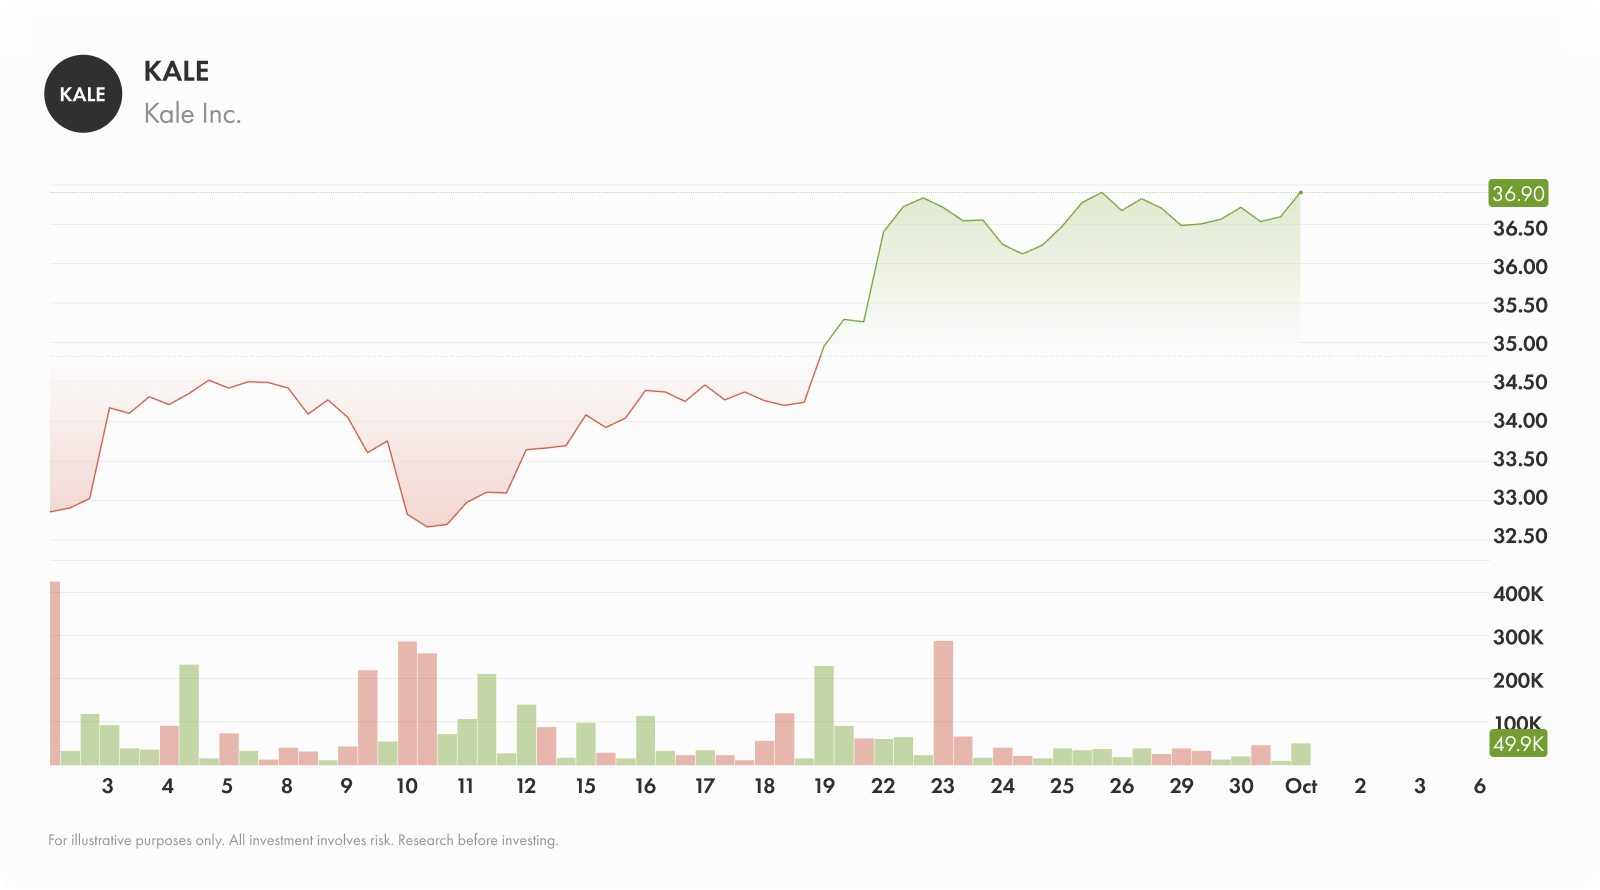
You can typically find volume data on stock charting software or trading platforms. It’s usually represented as a series of vertical bars at the bottom of a price chart. A taller bar means higher volume, and a shorter bar means, as you could guess, lower volume.
There are two different types of trading volume: absolute volume and relative volume.
Absolute volume is the raw number of trades.
Relative volume is slightly more complex. It compares today’s volume to the average volume over a certain time period.
How is trading volume calculated?
Trading volume is a simple count. It adds up every share or contract that changes hands over a set period, whether that’s a minute, a day, or a full year.
Because every trade needs both a buyer and a seller, one completed transaction is counted once. If one investor buys 500 shares and another sells them those same 500 shares, the volume for that trade is 500 — not 1,000.
You rarely need to tally this by hand. Charting platforms track it for you and display it as the volume bars beneath the price chart. What matters more is reading that total in context by comparing it to the stock’s typical activity.
Why volume matters in trading
Measuring the market
Volume is an essential gauge of market participation and conviction. When a stock’s price is rising on high volume, it tells you that a lot of people are actively buying, which confirms the strength of the move.
If that same stock’s price is rising but on low volume, it’s a bit like a car running on fumes. It likely means a few big players are betting on the stock, but most investors are staying away. So while it might go further, there’s no real power behind it.
Relative volume adds useful context here. For example, if today’s volume is twice the 20-day average, that tells you something notable is happening — like the difference between a normal day at the mall and the day before Boxing Day.
Leading vs. lagging
On top of informing traders about the scale of a move, volume reveals something about timing. But there are two different schools of thought on this.
Some traders consider volume a leading indicator, meaning it can hint at future price moves. For instance, a sudden spike in volume might signal a change in sentiment before the shift is fully reflected in a stock’s price. Other traders, meanwhile, view volume as a lagging indicator, because it confirms a move after it’s already happened or underway.
In truth, volume is a bit of both — it can be an early-warning sign, but it’s more commonly used to confirm what the price is already signalling.
Getting multiple sources
There are a lot of indicators traders look at to analyze a stock. Volume is a common secondary indicator that can help confirm whether a stock is about to breakout, because it can confirm or call into question the depth of investor enthusiasm for the stock.
Using volume to confirm trends
This dovetails with our multiple-sources point: in addition to confirming the findings of other indicators, volume can be used to confirm bigger market trends . A healthy, sustainable trend will almost always be accompanied by high volume in the direction of the trend.
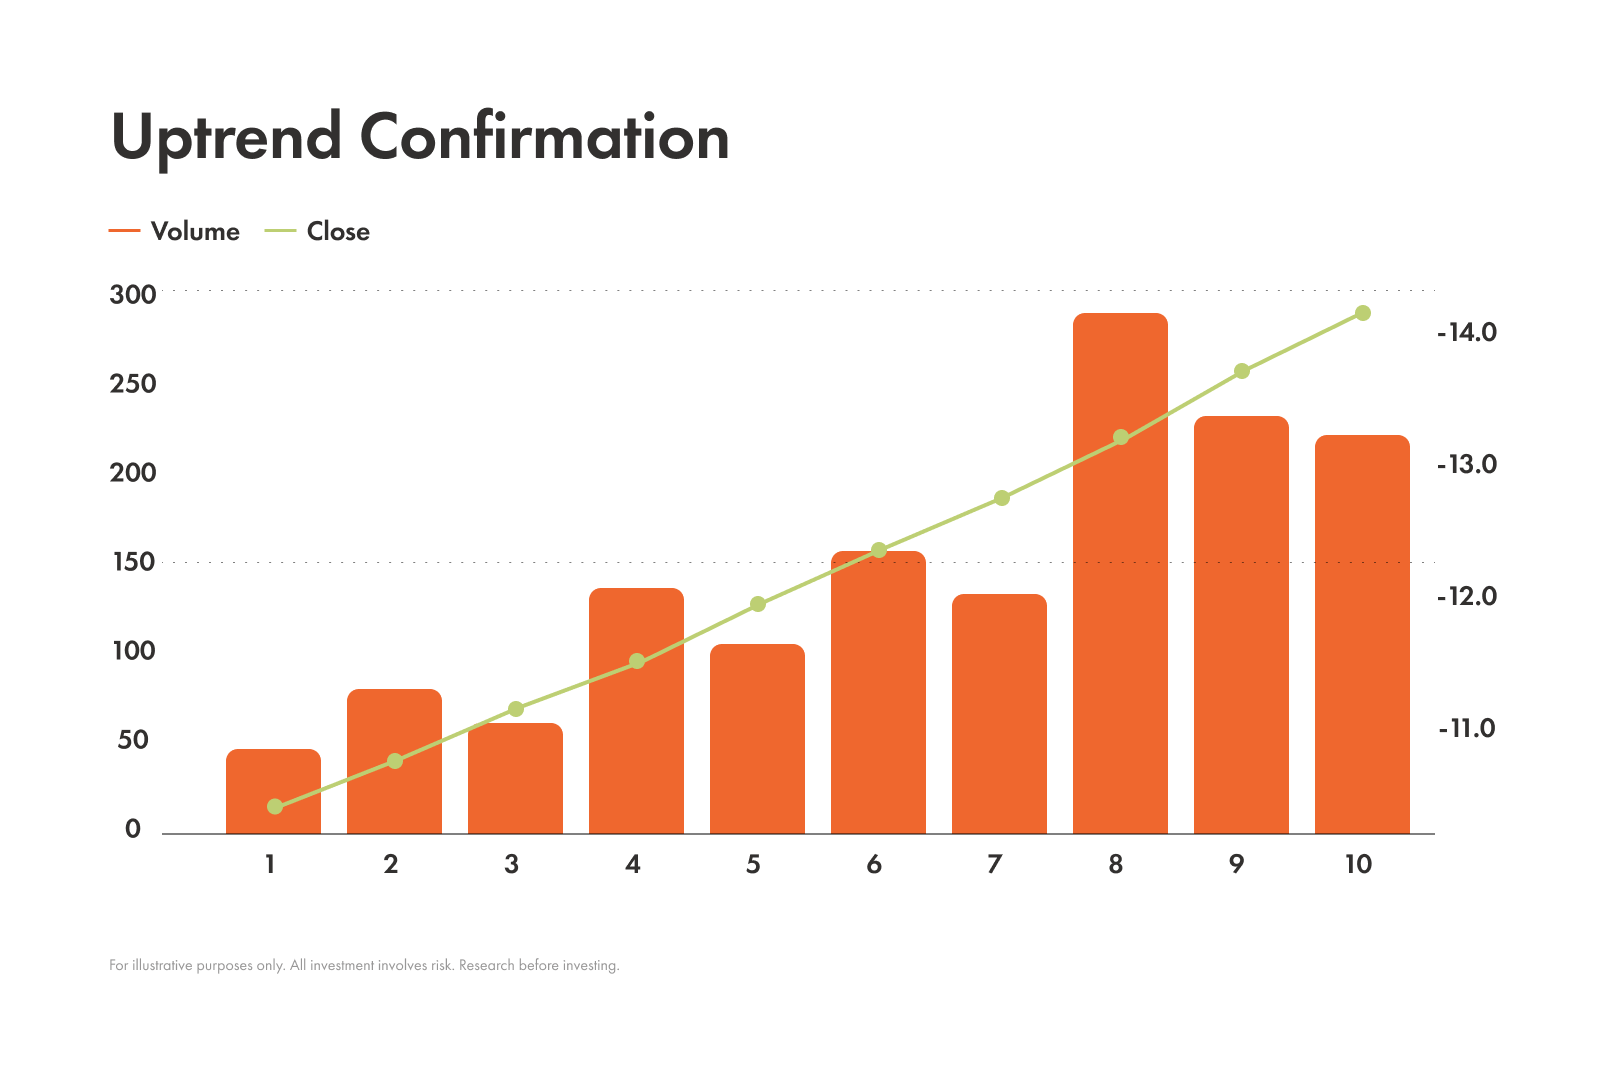
Uptrend confirmation
To confirm a strong uptrend, you want to see high volume on up days when the price is moving higher and low volume on down days when there are minor pullbacks.
Low-volume pullbacks tell you that investors aren’t super eager to dump their shares, and that a minor price decline is likely just some people taking profits and that investors, broadly speaking, haven’t lost faith in the stock.
Downtrend confirmation
The same logic applies to a downtrend. A strong downtrend will have high volume on the down days and low volume on the up days. The low-volume rallies indicate weak buying interest, suggesting the bear trend is still in control.
Using volume to spot potential reversals
Now for the really interesting stuff: volume analysis can be a useful tool for spotting when a trend is losing steam and at risk of reversing.
Volume surge at key levels
Let’s say a stock is in a strong downtrend, but then it suddenly hits a key support level — i.e., a price point where the price stops falling. If the price bounces off that level with a giant surge in volume, it’s a strong sign that big players are stepping in to buy, and it could mark the beginning of a new uptrend.
Volume drying up
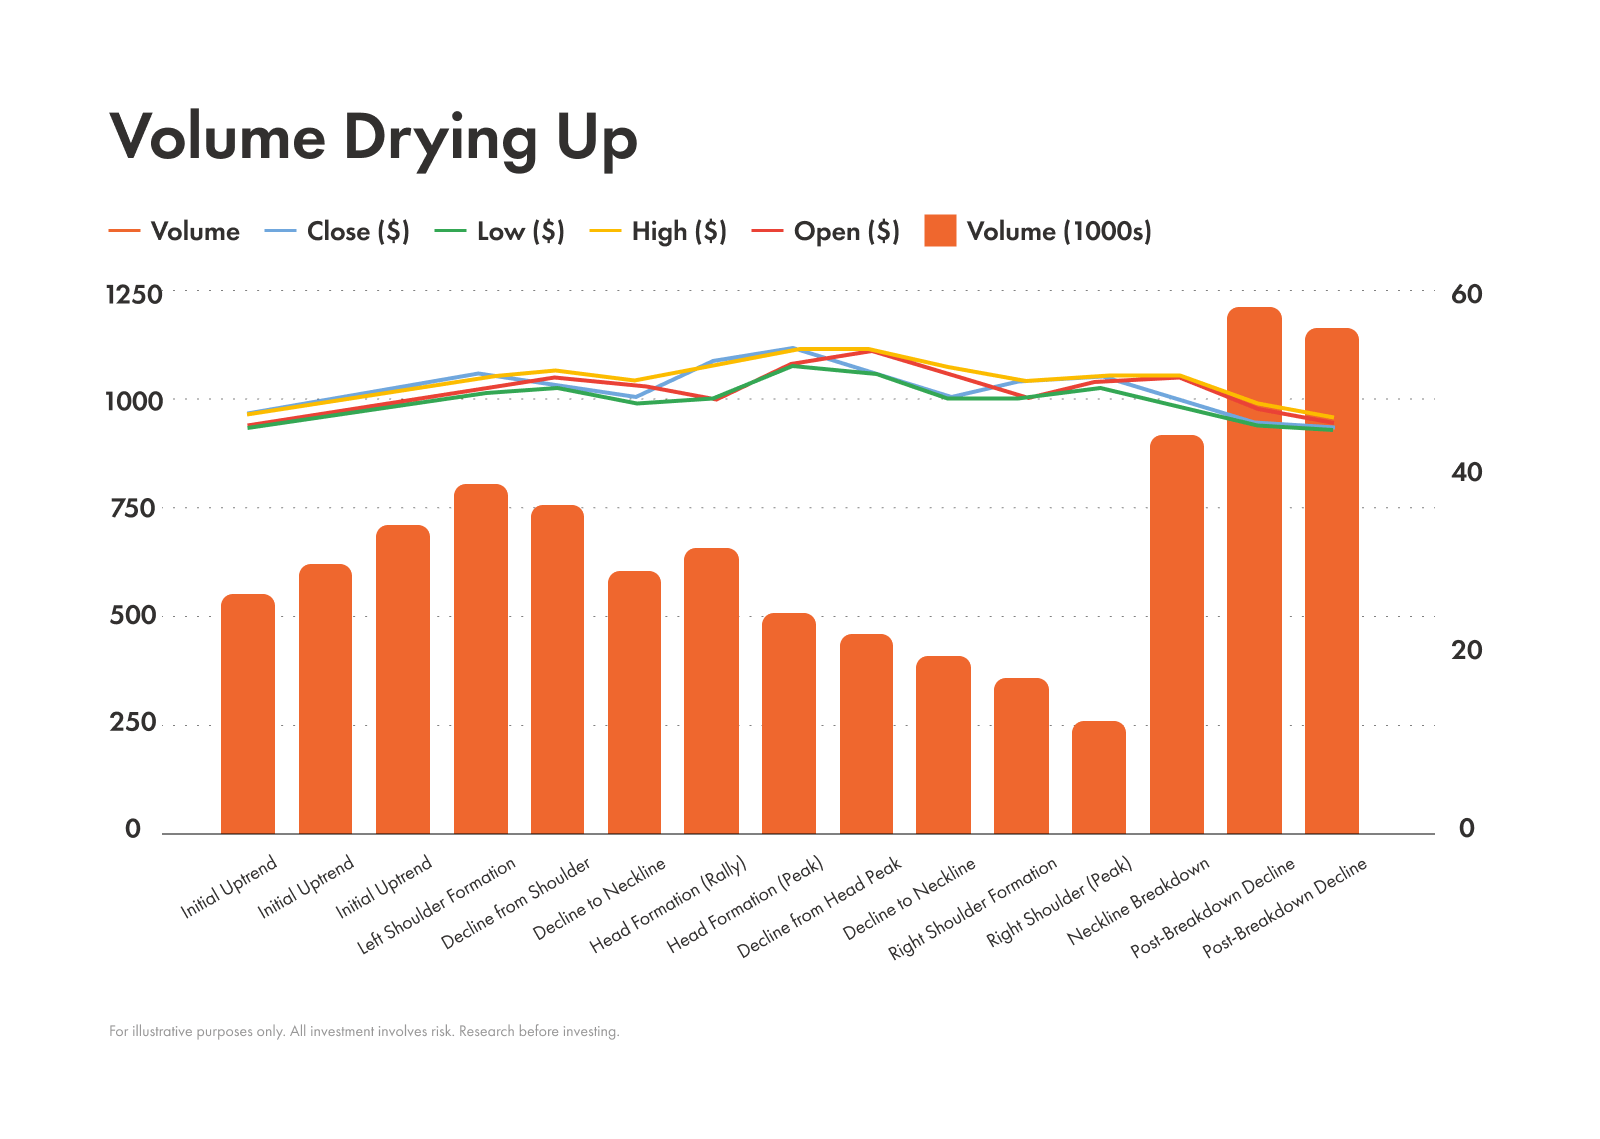
The opposite can also signal a reversal. Let’s say a stock has been in a long, steady uptrend. In that case, if the price keeps moving higher but the volume falls lower and lower, it might signal that momentum is fading. This is often called volume exhaustion, and it can precede a sharp reversal.
Understanding volume spikes
A sudden, massive spike in volume is a clear sign that something is happening.
They can be triggered by all sorts of things, like the release of earnings reports, news stories, or economic data.
These volume changes could be good or bad news. The key here is the context.
Breakout confirmation
When a stock breaks out of a consolidation pattern, you’ll see a significant volume spike. This confirms that the move is real and not fake.
A breakout on low volume is a warning sign; it could be a false breakout that quickly fails.
Exhaustion moves
Sometimes, a volume spike happens at the end of a long trend, not at the beginning of a new one. This is often called a blow-off top for an uptrend or a capitulation for a downtrend.
A blow-off top happens when a stock rapidly goes up in price, and the last remaining buyers rush in, creating a massive volume spike and a final price surge before the trend collapses.
A capitulation is the opposite, where panicked sellers dump their shares in a final, high-volume crash before the selling pressure is exhausted.
Price-volume relationship basics
Is all that super confusing? We hope not! But just in case it is, we created this little guide to help you remember the relationships between changing volume and changing stock prices and what each often means:
Price | Volume | What it signals |
|---|---|---|
| Rising | Rising | The most bullish signal. It indicates strong demand and conviction — a rocket launching with a full tank of fuel. |
| Rising | Falling | A red flag. It suggests the upward move is weakening and buyers are running out of steam, a sign of a potential reversal. |
| Falling | Rising | A very bearish signal. It indicates strong selling pressure and suggests a downtrend is likely to continue — aka everyone is dashing toward the exit. |
| Falling | Falling | A more neutral or even potentially bullish sign. It suggests selling pressure is weak and investors aren’t itching to dump their positions, which often happens during a pullback in an uptrend or when a downtrend is losing steam. |
Popular volume-based indicators
While looking at volume bars is great, there are indicators that simplify the analysis and do the math for you.
On-balance volume (OBV)
This indicator is like a running total of volume. It adds volume on up days and subtracts it on down days. When the OBV line is rising, it means buying pressure is higher. When it’s falling, selling pressure is higher. Traders look for divergences where the OBV line doesn't match the price action.
Volume weighted average price (VWAP)
VWAP is a moving average that factors in volume. It’s the average price a stock has traded at throughout the day, weighted by volume.
Institutional traders often use VWAP to measure their execution quality. If they buy below VWAP, it’s considered a good entry.
Accumulation/distribution line
Similar to OBV, this indicator tries to determine if money controlled by financial professionals is accumulating/buying or distributing/selling a stock. It works by factoring in where the price closes in relation to its high-low range for the period.
Common mistakes in volume analysis
Before using volume analysis to trade, consider some of the most common pitfalls:
Over-relying on volume alone: Volume is a supporting actor, not the star of the show. Never use it in isolation. Always look at price action, chart patterns, and other indicators to build a complete picture.
Misreading low-volume moves in illiquid markets: Not all markets are created equal. Low-volume moves for highly liquid stocks can be a signal, but in illiquid, small-cap stocks, low volume is the norm and the signals are much less reliable.
Ignoring news catalysts: A sudden volume spike can be a great signal, but what caused it? Always check for news that might be driving the volume, because it might change the context.
Practical tips for using volume in trading
Now let’s hit some practical tips:
Combine with other indicators: Use volume to confirm patterns you see on the price chart, like breakouts from resistance or bounces off support , trendlines , or candlestick patterns .
Look for confluence: When multiple indicators or signals point to the same conclusion, it’s called confluence. This can suggest you’re on to something.
Adjust expectations: A volume spike on a 5-minute chart means something different from a spike on a daily chart. The significance of the signal depends on the timeframe and the asset class you're trading.
The bottom line
Volume analysis is a useful tool that helps confirm whether a trend has legs, spots when momentum is fading, and helps you distinguish between healthy breakouts and fakeouts. Used by traders as a gut check, if a move doesn’t have the volume to back it up it might be a reason to be skeptical.
But it’s important to remember that volume analysis isn’t a magic bullet and should always be used in conjunction with price action and other indicators, like your favourite moving averages .
Knowledge check: See what you learned